We use cookies to improve your experience on our website and for marketing. Private Policy.

Sample Report 25. Customer Based Basket Analysis
Report Description
This is one of the most Magento 2 advanced reports’ examples among all our sample reports. It consists of 4 pages and allows users to understand how customers tend to form their combination of products they put in the cart (e.g. one order).
The Magento mobile app also supports this type of report. First page of the report allows marketers to select a product that has the highest amount of related products; other products bought by the same customer(s).
Embedded interactive report
Open Customer Based Basket Analysis report in Power BI
Report Content
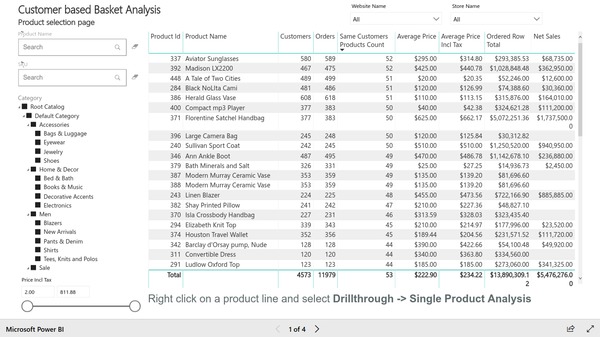
Basket analysis report - first page
First page of the report shows a list of products with various filters that could be used to limit the set of products to those we want to analyze.
List of products has such measures as "Customers Count" and "Same Customers Products Count".
-
The first one shows how many customers purchased the product;
-
The second shows how many of the other products those customers bought.
It allows the user to concentrate the further analysis on the products that are often bought together with other products in the same order.
This page of the report includes:
Filters:
-
Website and store filters.
-
Product name search field allows users to search a product by entering its name (or part of its name).
-
SKU search field allows you to search by entering SKU number or its part.
-
List of categories where one or multiple categories could be selected for filtering the products list.
-
Price range filter will filter the list of products by price.
-
Table with products lists available products with some sales metrics and measures "Customers Count" and "Same Customers Products Count" explained before.
In order to continue the analysis, a product should be selected in the list. Right-click and selection of Drillthrough -> Single Product Analysis will navigate a user to the second page of the report.
Basket analysis report - second page
Second page will show the data in relation to the selected product.
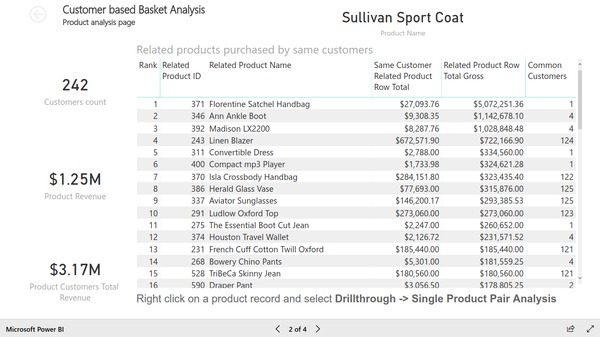
This page has a list of products that were purchased by the customers who bought the product that is under the analysis.
KPIs:
-
customers count - amount of customers who purchased the analyzed product;
-
product revenue - total revenue, generated by the analyzed product;
-
product customers total revenue - total revenue, generated by those customers who purchased the analyzed product.
Relation between the KPIs may help to understand how the impact of the analyzed product was on the revenue from the customers who bought this particular product.
Table with products lists items purchased by the same customers who bought the analyzed product. The measures help to identify the most important products from that list:
-
Same Customer Related Product Row Total - shows the revenue from the product from customers who also bought the analyzed product;
-
Related Product Row Total Gross - total revenue that the product has generated;
-
Common Customers - amount of customers who bought both products: analyzed product and the product listed;
-
Relation between measures in the table may help estimate how significant the relation between two products was for the revenue.
To continue the analysis, users may select a single product from the related products list. This will form a pair of products for further analysis. To select related product, the user needs to right-click on one of the rows and select Drillthrough -> Single Product Pair Analysis.
Basket analysis report - third page
Third page of the report is dedicated to single products pair analysis. Please, refer to data actualization status report in order to keep your online store’s statistics always up to date.
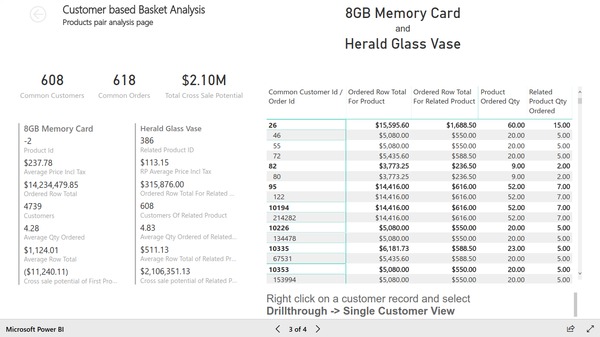
Main KPIs on this page in Magento reporting tools:
-
Common Customers - amount of customers who bought both products;
-
Common Orders - amount of orders where both products were bought together;
-
Total Cross Sale Potential - the total potential of cross sale of products, calculated as revenue that will be received if all customers who bought one product will also buy another.
Rest of the KPIs are presented row by row for first analyzed product and for selected related product:
-
Product ID
-
Average Price incl Tax
-
Ordered Row Total - revenue from the product
-
Customers - amount of customers who bought the product
-
Average Qty Ordered - average quantity of products ordered in a single order
-
Cross sale potential for each product - the potential revenue that could be received if the product will be purchased by all customers who bought another product in the analysis.
The table lists customers and their orders where the two products appear. Here a user may select a particular customer from the list and switch to the next page of the report by right-clicking on a row in the table and selecting Drillthrough -> Single Customer View.
Basket analysis report - forth page
The last page of the report shows the orders paid by a single customer. Learn how to integrate all samples reading our valuable blog article on Magento Power BI.
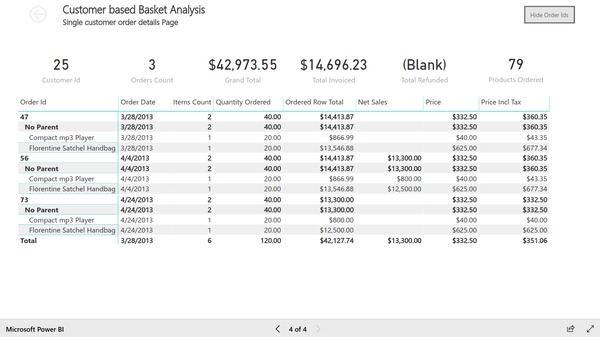
This page includes:
-
KPIs: customer ID, orders count, grand total, total invoiced, total refunded, products ordered - all in relation to the selected customer.
-
Table with orders and products in those orders.
Please, note that the page does not disclose customer’s private information to stay compliant with possible privacy rules.
How It Works?
From simple reporting to more advanced analytics, integration with Power BI opens a lot of possibilities for Magento merchants. The benefits of Customer Based Basket Analysis report are many. They are listed below.
After conducting this report, a sales manager can better organize a future cross-selling campaign. It can be done in such a way. Related products frequently bought within one of the products’ groups will be listed below the main product item.
Then, when a customer clicks on the product’s page, under this particular product the Magento BI platform will show him or her a carousel of the other products from the same cross-selling order group.
In addition to that, the company may decide to change their core marketing strategies, mission and vision statements, etc.
The techniques of the change may include (but not limited to):
-
Changing the store layout according to buying trends;
-
Cross-selling and bundles implementation;
-
Customized emails with add-on sales products;
-
Catalog design for new promo campaigns and discounts.
For more information on our products and other Power BI reports, including Magento reporting tools, click here.