We use cookies to improve your experience on our website and for marketing. Private Policy.

Sample Report 12. Sales Rule Performance Analysis
Report Description
This report consists of three pages where users can first select a price rule, then select a product to be analyzed. How often the product was bought with applying the sales rule and how this influenced the product's sales during marketing campaigns or rebate offerings - all these are here!
Embedded interactive report
Open Sales Rule Performance Analysis report in Power BI
Report Content
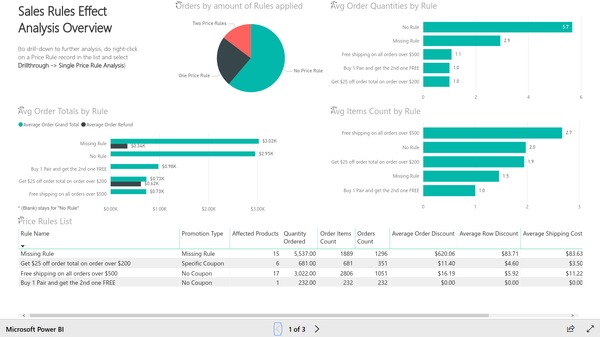
The first page of Sales Rule Performance Analysis Magento custom report shows an overview of sales rules and their influence on revenue.
This report page includes:
-
Pie chart with orders by amount of rules. Shows the proportion of orders that have no rules, one rule, two rules and so on.
-
Bar chart with average order quantities by rule. Includes also a bar indicating quantities that were purchased without any rule applied. This chart allows to estimate how the presence of a rule affects ordered quantity.
-
Bar chart with average Items Count by rule. Includes also a bar indicating items that were sold without any rule applied. This chart allows to estimate how the presence of a rule affects the amount of products bought in one order.
-
Bar chart with Ordered Total by rule. Includes also a bar indicating Ordered Total sold without any rule applied. This chart allows us to estimate how the presence of a rule affects the ordered total amount.
-
List of price rules. The list presents price rules with some extra measures that help estimate how often the rule was applied to orders.
By selecting a rule in the list of price rules, a user can right-click and select Drillthrough -> Single Price Rule Analysis to navigate to the second page of the report. Be sure after doing research based on our Magento reporting tools, your sales will grow smoothly and constantly.
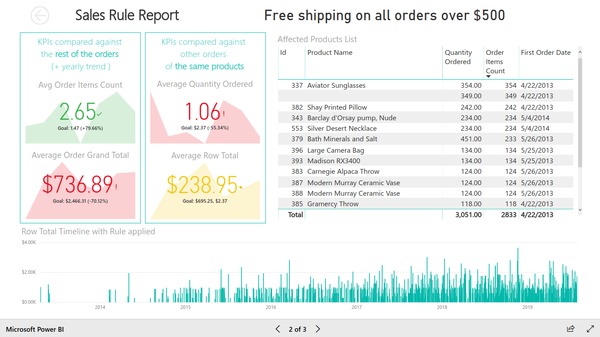
Second page shows an estimation of the influence of the selected price rule on the orders and sales. Sales Rule Performance Analysis report - product selection criterion.
The second report page includes:
-
KPIs compared against the rest of the orders. Includes Average Order Items Count and Average Order Grand Total.
-
KPIs compared against other orders of the same products. Includes Average Quantity Ordered and Average Row Total.
-
KPIs are color-coded. If the price rule makes a positive impact on the listed KPIs, it will be marked in green color. If the influence is negative - red color will be applied. No influence or the influence is insignificant - the parameter will be marked as yellow. The values that the KPI is compared against are listed as small text under the KPI value.
-
Timeline shows Row Total values from Order Items with the selected rule applied.
-
Affected products list. This table lists products that were affected by the price rule. You, as a user of this report, can select a specific product to navigate to the next page of this Sales Rule Performance Analysis report. To navigate, right-click and select Drillthrough -> Single Rule for Single Product.
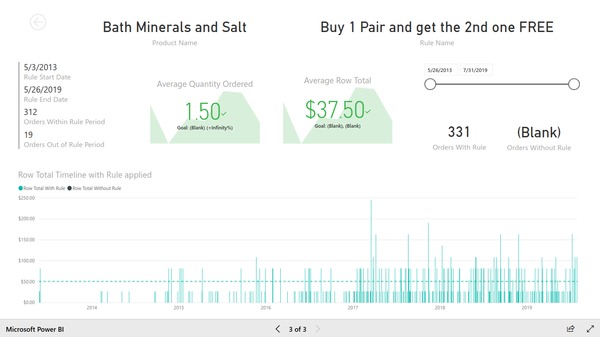
The third page shows sales rule analysis: how often the product was bought with applying the sales rule and how this influenced the product's sales during marketing campaigns or rebate offerings.
This page includes:
-
Date Filter where you can select the date for your further analysis and interective report.
-
KPIs: Rule start date, Rule end date; Orders within rule period; Orders Out of rule period; Average Quantity Ordered and Average Row Total compared against same metric for orders that were not affected by the rule; Orders with rule, Orders without Rule.
-
Timeline with the product orders represented as row-total values. Product orders with rule and without rule applied are marked by different colors.
How It Works?
If you want to improve your sales team performance and boost your firm's revenue, analyzing sales data by certain sales rules is a crucial element of your monthly routine.
Before you start your research, define one of the goals you will be focusing on to achieve the best results. Sales Performance Rule Analysis may help solve the following tasks:
-
improve your sales team performance by analyzing every team’s member sales;
-
boost your customers’ satisfaction and engagement by analyzing products they often buy; create bundles and promo campaigns;
-
make a very precise sales forecasting prediction by analyzing customers buying behavior of the last half of the year.
Check out the Top Products report, it may be helpful in your research. Read about Power BI Integration with Magento bi platform to get more information on how this and other reports can help your business evolve.